
In 2019, U.S. Senator Bernie Sanders made headlines when he wrote in a Wall Street Journal editorial that the three richest Americans together owned more wealth than the bottom half of the country. He was right. According to Forbes estimates from 2016, the combined net worth of Bill Gates, Warren Buffett, and Jeff Bezos exceeded the total wealth of roughly 150 million Americans.
We define wealth here as total assets—savings and investments minus all debts. Framed this way, the inequality becomes striking: if we confiscated all the wealth of those three billionaires, it would be enough to pay off the debts of the poorest half of Americans, with money left over.
Wealth disparities have existed since humans first practiced agriculture, and they continue to shape almost every aspect of modern life. Wealth confers power, but even more importantly, security. With sufficient wealth, one can weather crises that devastate others and maintain comfort even with a modest income.
Why do wealth gaps endure? Shouldn’t random chance – wars, recessions, inheritances, and shifting markets – eventually spread wealth more evenly across generations? To understand why that doesn’t happen, let’s look at a simple model of how wealth accumulates.
A Simple Gambling Model
Imagine a gambling game: you pay $1 to play, then draw a number from 1 to 100. If your number is greater than 49, you win $2; otherwise, you get nothing. The odds slightly favor you: there’s a 51% chance of winning $1 and a 49% chance of losing $1. On average, you earn 2 cents per play—but the game carries risk.
Now compare two players: one starts with $2, the other with $200. Mathematically, the odds are identical for both, but their experiences diverge sharply. The poorer player can only afford to lose twice before going broke, while the richer player can afford to lose two hundred times and keep playing.
When we simulate this game (see figure 1), the difference is dramatic. After 100 rounds, or as many as the players can afford, the poorer ones earn an average of 60 cents, with only about 20% staying solvent. The richer players, in contrast, nearly always finish with the full expected gain of $2. In short, the rich make roughly three times more—from the same game.

Figure 1. Distribution of total earnings after playing 100 rounds among 10,000 players. Blue bars represent poor players starting with $2; orange bars represent rich players starting with $200. The tall blue bar at zero shows that 80% of poor players went bankrupt.
Leveling the Playing Field
What if we allow poor players to go into debt? Suddenly, the inequality disappears (figure 2). With temporary borrowing, both groups earn the same average of $2 over 100 rounds. In other words, access to credit eliminates the disproportionate disadvantage of being poor.
In reality, however, this is not how credit systems work. The poor often face predatory lending – high-interest loans that make their situation worse – while the wealthy can use their assets to secure low-interest credit.
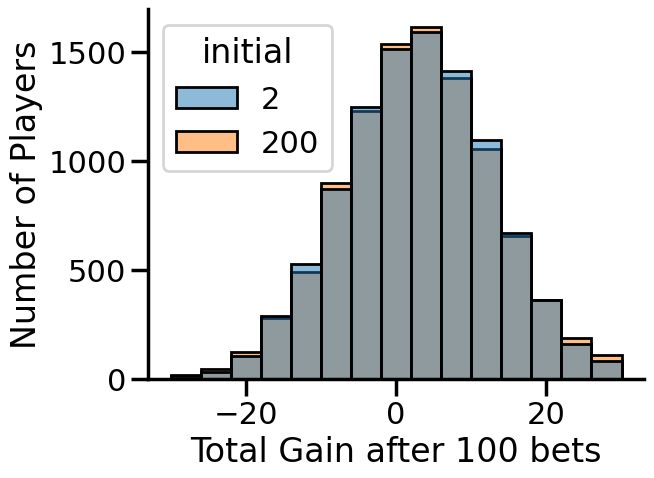
Figure 2. Earnings distribution when all players may borrow. Poor and rich players now earn the same average return.
Survivorship Bias and the Illusion of Meritocracy
Next, imagine we ignore bankrupt players and only look at those who make it to the end. The results flip (figure 3): surviving poor players earn an average of $11, far more than the $2 average among the rich. This “survivorship bias” gives a misleading picture: only the luckiest poor players are visible, creating the illusion that anyone can succeed through skill or effort alone.

Figure 3. Earnings distributions excluding bankrupt players. Only 20% of poor players survive, but their average gain is much higher than the rich.
This simple game reveals a deeper truth: the wealthy stay wealthy partly because they can afford to take risks. When opportunity requires gambling, only those with a financial cushion can keep playing long enough to win.
Further Reading
Economists have long studied the origins and persistence of wealth inequality. One classic observation is the Pareto principle, which states that 80% of wealth is held by 20% of people. More generally, wealth follows a Pareto distribution, whose inequality depends on how quickly wealth grows relative to the overall economy. For an accessible overview, see this review in Science.
Wealth inequality is also more difficult to measure than income inequality. For a deep dive into measurement and recent trends, see this review. Finally, if you want to dive into the mathematical foundations behind this topic (and the inspiration for this article), read this Econometrica paper that formally models wealth accumulation over time.
